


How to monitor your Python Flask web application using Azure Application Insights
24 Jul 2018 in DevOps | Microsoft AzureI recently worked with a customer on hosting Python Flask web app and web jobs on Azure App Service. When it comes to monitoring, Azure Application Insights is really awesome because it allows to collect traces, requests and exceptions very easily and build analytics queries and dashboard for visualization out of the box.
Azure Application Insights comes with a Python SDK that supports direct integration with the Flask Framework. To help you to get started quickly, I have made this quick start sample available on GitHub.
The most important parts of this sample are described below.
Thanks to my colleague Clemens for the precious help.
Create an Azure Application Insights resource
To monitor your Python Flask app, you need create an Azure Application Insights resource and get the instrumentation key. In order to do that, you can follow this documentation.
Set up Application Insights for Flask web app
First, you need to add a pip requirement for applicationinsights
Then, you can initialize Application Insights like this:
from applicationinsights.flask.ext import AppInsights

# create Flask app
app = Flask(__name__)
app.config['APPINSIGHTS_INSTRUMENTATIONKEY'] = 'YOUR_INSTRUMENTATION_KEY'
appinsights = AppInsights(app)

# force flushing application insights handler after each request
@app.after_request
def after_request(response):
    appinsights.flush()
    return response
Log traces to Application Insights
After Application Insights has been initialized on the Flask web app, you can just get a reference to the logger using app.logger and then use any logging functions available on it:
@app.route("/")
def hello():
    app.logger.debug('This is a debug log message')
    app.logger.info('This is an information log message')
    app.logger.warn('This is a warning log message')
    app.logger.error('This is an error message')
    app.logger.critical('This is a critical message')
    return "Hello World!"
Log exceptions to Application Insights
By default, Application Insights will log every unhandled exception in your Flask application. If you log your exception to personalize http responses, you can use the app.logger.exception(e) function to report exception to the Application Insights handler.
Continue to log information on stdout
By default, when registering Application Insights with your Flask application, you will not receive any trace on stdout. If you want them to be back, you need to add a StreamHandler to the Flask application logger.
# import
from logging import StreamHandler

# keep stdout/stderr logging using StreamHandler
streamHandler = StreamHandler()
app.logger.addHandler(streamHandler)
Personalize the log level and log format
By default, Flask application logs only message starting warning level using a default format. If you want, you can change this behavior:
# after Application Insights configuration

# keep stdout/stderr logging using StreamHandler
streamHandler = StreamHandler()
app.logger.addHandler(streamHandler)

# define log level to DEBUG
app.logger.setLevel(logging.DEBUG)

# apply same formatter on all log handlers
for logHandler in app.logger.handlers:
  logHandler.setFormatter(logging.Formatter('[FLASK-SAMPLE][%(levelname)s]%(message)s'))
Visualization
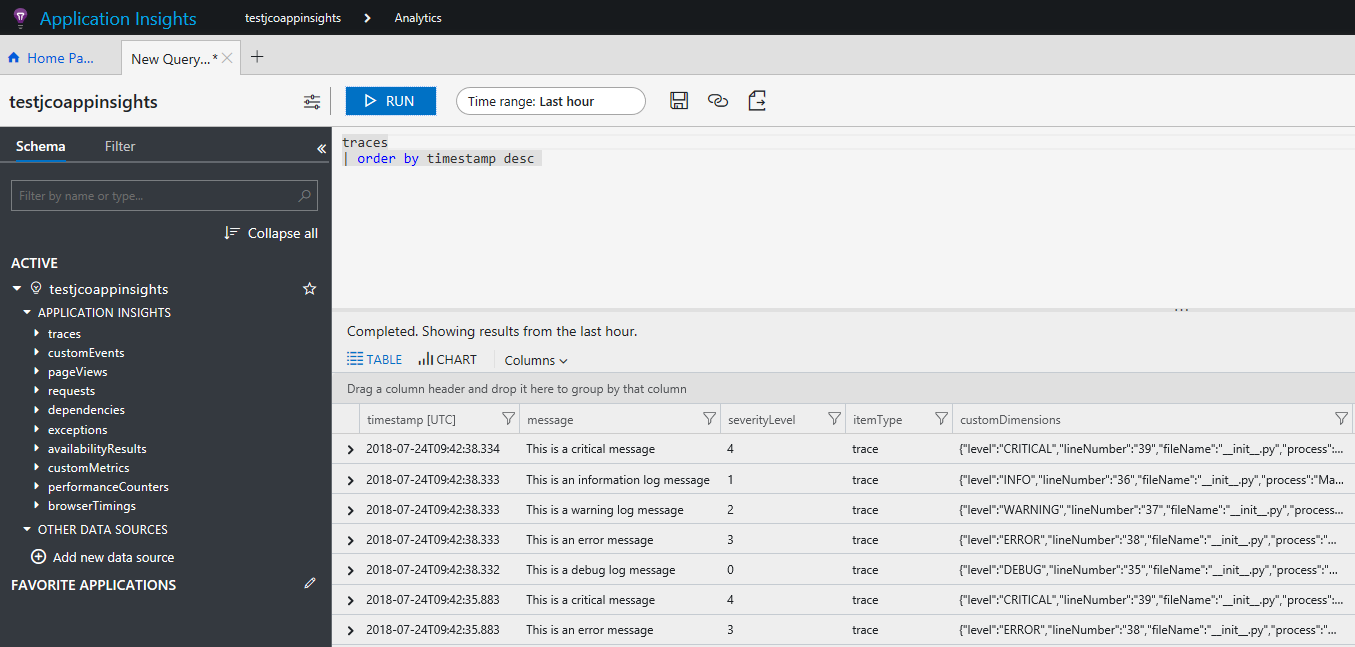
After a while, you should be able to see generated data in the Analytics tools provided by Azure Application Insights (click on the Analytics button in the Azure portal):
traces:
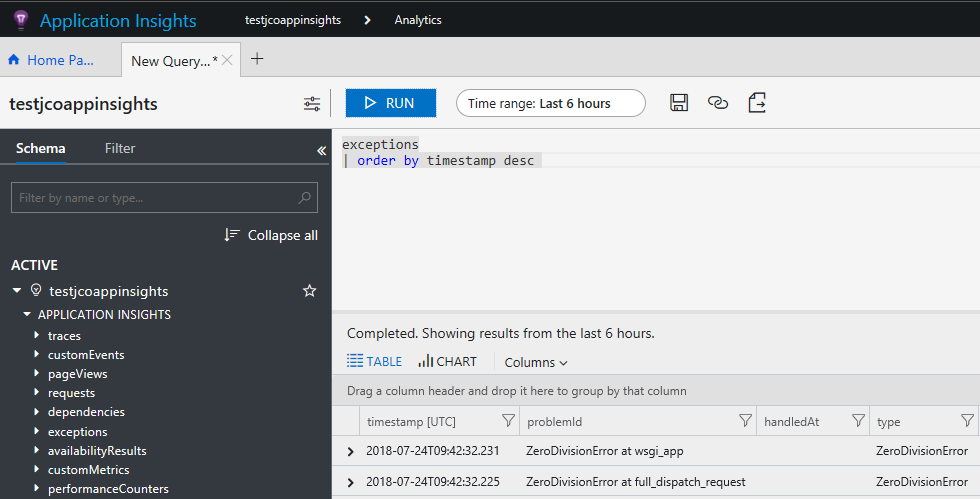
exceptions:
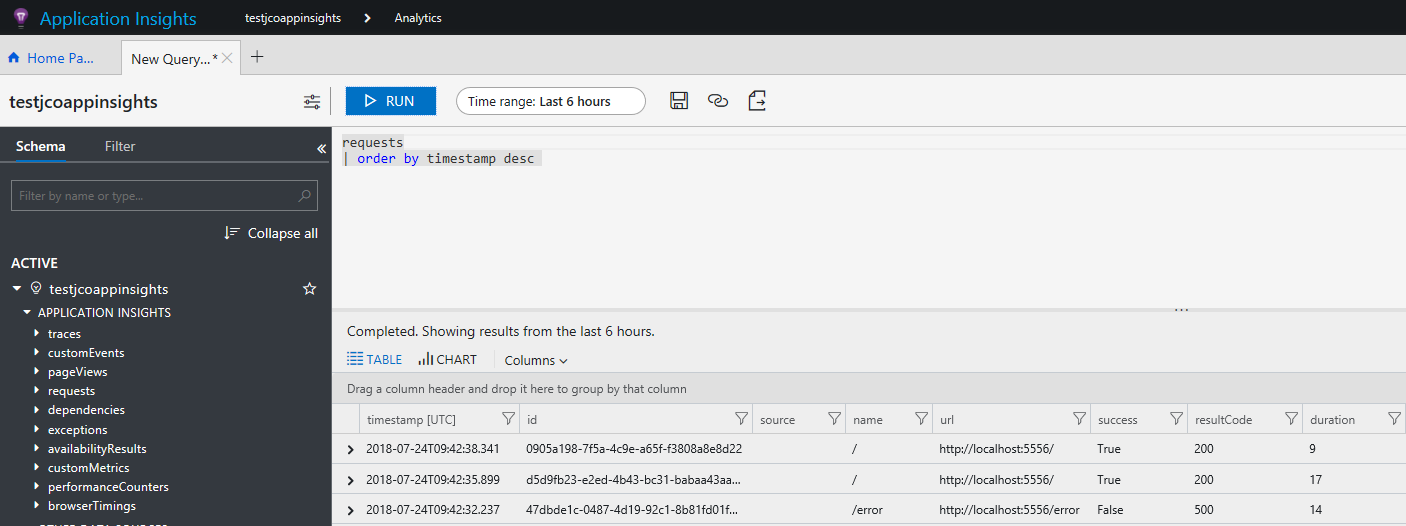
requests:
Happy logging with Application Insights!